
As I was working with Maine to wrap up the current session, I noticed what seemed to be a large number of veto overrides. Which got me thinking. How many veto overrides have there been? Do some states do it more than others? Maine seems like it has an awful lot, surely that’s an outlier? Are there any trends building over the last few years? Luckily we have all the data we need to try to answer these questions. So I created this Tableau workbook to explore the data (notice the tabs across the top stepping through all of the visualizations below).
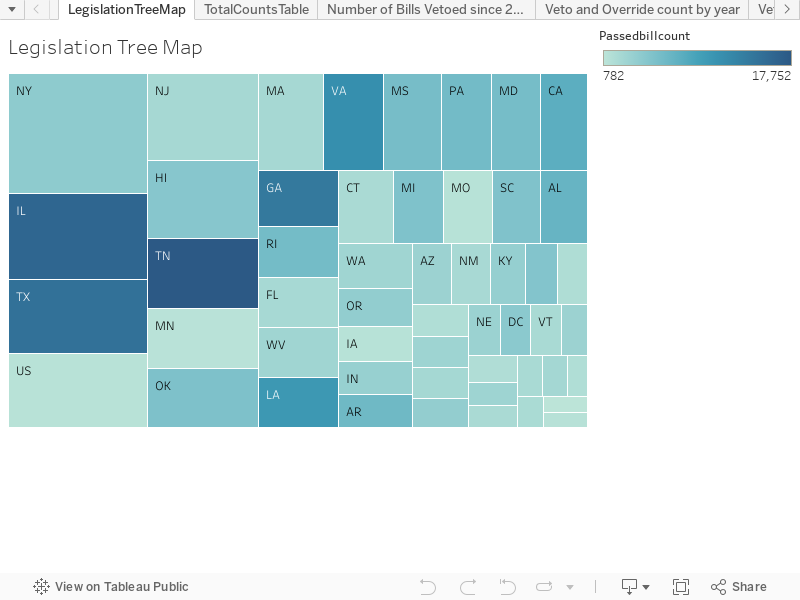
First check out this tree map showing how many bills are introduced by state (size of box) and how many are passed (color of box). Includes federal bills as “US”. These counts are since 2011 and include resolutions. You can see that the states with the most passed bills (darkest colors, like TN) aren’t necessarily the ones with the most bills introduced (biggest boxes, like NY). I’ve pointed out this disconnect in several posts before, but I thought this presentation is a great new way to look at this information, and it’s relevant to what follows. Notice the pale blue US square in the bottom left corner; that’s Congress.
OK, with that in mind, let’s look at how many bills are introduced, passed, vetoed, and have vetos overridden. These totals are for all bills since 2011, including federal bills.

I like this presentation because it really emphasizes just how few bills have a veto, much less get their veto overridden.
Here is a map of where bills get vetoed, counts since 2013
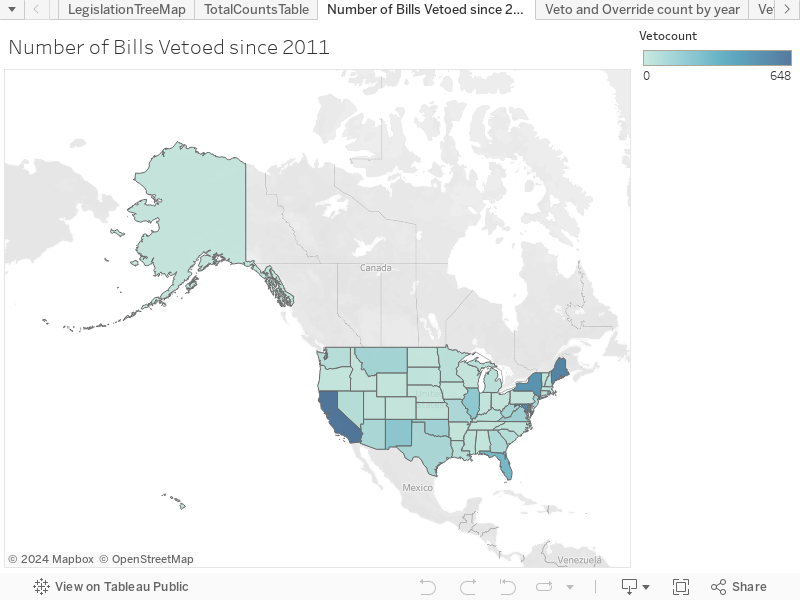
There is massive variation between the states, with just four states, CA, MD, ME, and NY having by far the lion’s share of all vetos over the last several years.
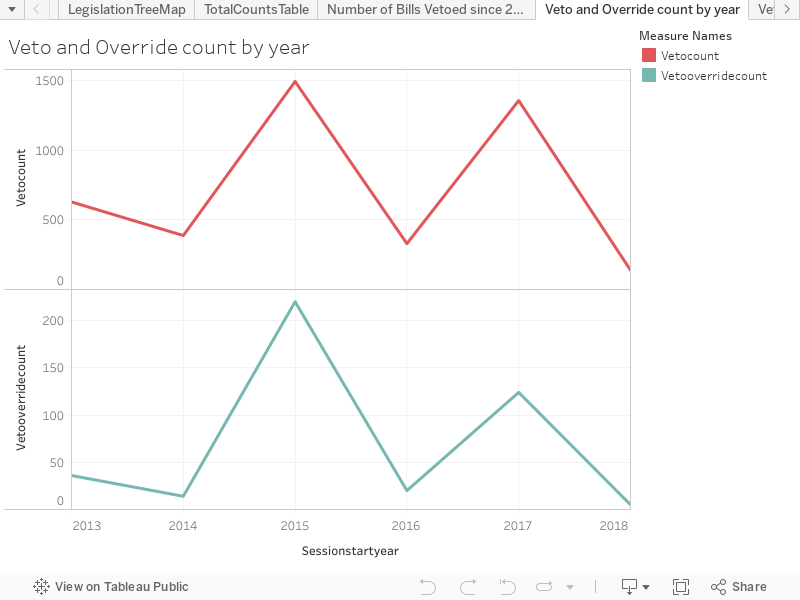
The next question I had is: have there been any changes to the number of bills vetoed over the years? Note that some states have a two-year sessions, so their entire count will fall on the odd year (except NJ falls on even years). Since NY, ME, and CA have two-year sessions, that explains most of the year to year variation. Otherwise, the number of vetoes does not seem to be changing much from session to session, though I think you could argue the number of veto overrides are declining.
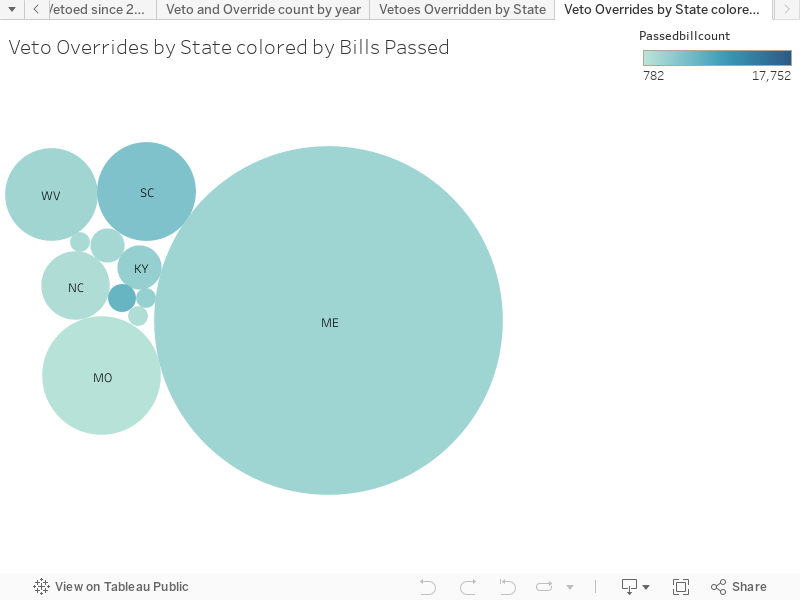
And now for the grand finale. Remembering that two year sessions show thier whole total on the odd year (for example below Maine’s 2015-2016 session had 174 veto overrides) here’s a look at how many bills each state had overridden by years. States not on the graph have not overridden a single bill since 2013.
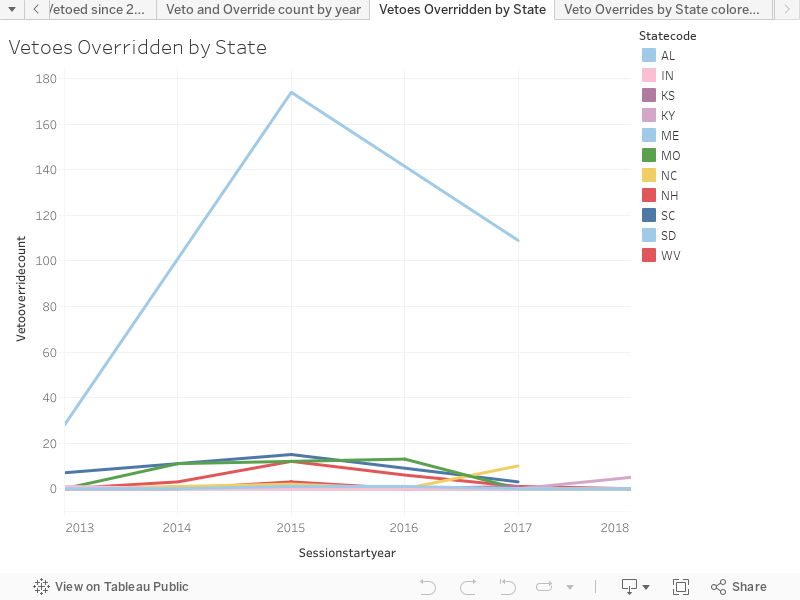
In conclusion, yes, Maine seems to be a significant outlier.
Note that not all the states were finished with their 2018 sessions when I did this analysis. Here is a snapshot of which states were in and out when I calculated the underlying counts:

Green = in, purple = out, gray = no session this year, LA = in special session right now. Thank you NCSL for your calendar.
About BillTrack50 – BillTrack50 is a user friendly free service that provides legislation research in all 50 states and federally. BillTrack50 also offers legislation and regulation tracking across the nation with tools to help organization stay on top of changes (bill sheets and alerts) and share legislation they are tracking with key stakeholders (legislator scorecards, widgets and stakeholder pages). If you are interested in learning more about how BillTrack50 saves organizations time and money, sign up for a demo and try it out BillTrack50 Pro for a month, for free.